Case study · Python · Flask · YouTube APIs · SQLite
The metric I wanted most turned out to be unavailable. Here's what I built around that.
A local dashboard that diagnoses what's wrong with each of my YouTube videos. This is how it's put together, why every flag carries its evidence, and what I learned when YouTube's API refused to give me click-through rate.
The problem
Studio is built to show numbers. I needed it to give a verdict.
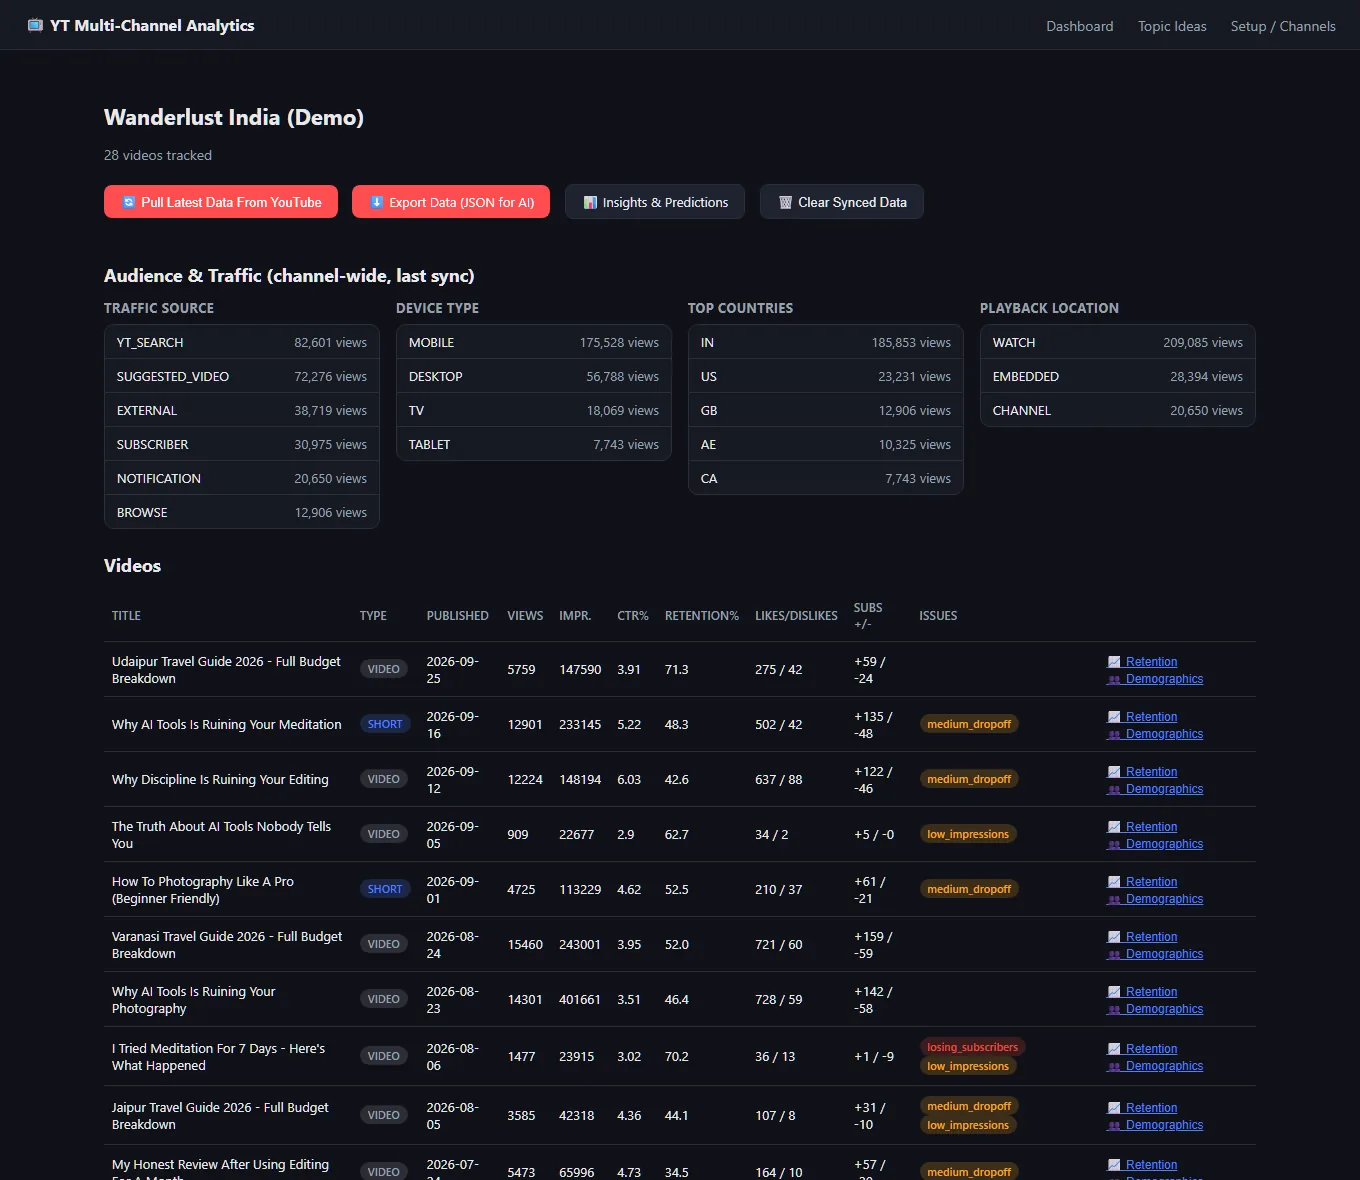
Three channels means three Studios, and each one is a wall of charts. None of them will say "this video loses viewers in the first seconds" or "this channel's last five uploads are doing worse than the five before". That reading is work I was doing by eye, every week, and it's exactly the kind of work a few clear rules can do.
So the brief was: pull the real numbers for every channel into one place, keep them, and put a verdict next to each video. And keep it on my own computer, because the data is mine and the tool is only for me.
The approach
A small Flask app, a SQLite file and read-only access.
The app is a local Flask server on 127.0.0.1. It signs in to Google with OAuth as a desktop app, asking only for two read-only permissions (view YouTube data and view YouTube analytics), and talks to the YouTube Data API for the videos and the YouTube Analytics API for the numbers. Everything lands in one SQLite file.
Every pull adds a new snapshot of each video's numbers instead of overwriting the last one. That one decision is what makes trends possible later: the history is already there. The rules, the insights and the topic page all read from the same file, so none of them need the internet once the data is in.
The surprise
The metric I most wanted, YouTube won't give to apps.
The obvious first rules were about click-through rate and impressions: a weak thumbnail shows up as a low CTR, a weak reach as low impressions. I wrote those rules first, and they're in the code today. Then I ran the real queries against a real channel and they all failed.
The first failure was my own: I'd used the wrong metric names. The correct ones are videoThumbnailImpressions and videoThumbnailImpressionsClickThroughRate, and with those the API stopped saying "unknown identifier". It said "the query is not supported" instead. I tried every shape I could think of, with and without the video dimension, with and without days, one video or many, the whole channel, and the answer never changed. The numbers in Studio's "Impressions and click-through rate" card aren't available through the public Analytics API at all.
So I did two things. I wrote the finding into the top of the fetching code, so the next person, or me in six months, doesn't lose time on it again. And I left the CTR and impressions rules in, honestly labelled, because they cost nothing and would work the day YouTube changes its mind. An earlier version of this page listed low CTR as a working flag. It isn't, and this page now says so.
The funnel check
When the inputs are missing, say so instead of guessing.
For long videos there's a "funnel" diagnosis that tries to name one bottleneck: not enough reach, a weak thumbnail, good clicks but weak retention, or healthy. It needs impressions, CTR, retention and views together. If any are missing, it returns INSUFFICIENT_DATA and lists what's missing. It never fills the gap with a guess.
That is what it returns for every real long video today, because impressions and CTR are never there. It would have been easy to make it say "healthy" and look finished. A tool that quietly invents a verdict is worse than one that says it can't tell, so the empty answer stays.
One report can fail
Every group of metrics is requested on its own.
The Analytics API is picky: many metrics only work with certain combinations, and the combinations can differ between accounts. If all the metrics for a video went in one request, one rejected metric would blank the entire row.
So metrics are split into groups: core numbers, dislikes, engaged views and playlist adds, cards, and premium views. Each group is its own query, tried for the whole batch first and then video by video if the batch fails. When a report isn't available, the app writes down which one and why, so a blank cell can be told apart from a zero.
How the rules think
Each flag carries its evidence, and some claim less than others.
Every issue is saved with a severity, a confidence and the evidence behind it, such as the threshold and the number that crossed it. Two rules show why that matters. "Low completion" says only that people watch little of the video overall. It can't say where they left, so it's marked medium confidence and points you to the retention curve. "Confirmed early drop-off" needs the retention curve and says the watch ratio fell by more than half in the first 10%. That one is high confidence, and it's the only rule that can say "fix your intro".
Shorts get their own thresholds, because a good Short is watched nearly to the end: a Short is flagged under 45% and 65% average view, while a normal video is flagged under 30% and 45%. And since YouTube doesn't label Shorts in its data, a Short is simply a video of 183 seconds or less. YouTube stretched the Shorts limit from 60 seconds to three minutes in 2024, so this is a rule of thumb, and I treat it as one.
Insights without a black box
A straight line, plain averages, and an explanation for every number.
The Insights page fits a linear trend through each channel's videos in order, with numpy, and projects it five videos ahead as a range. Next to it are averages grouped by video type, upload weekday and length, and the correlation of length, CTR and retention with views. There's no machine learning on purpose: with a few dozen videos per channel, a fancy model would fit the noise and I couldn't explain why it said what it said.
The page says so itself: the forecast gets more reliable with more videos, and it won't draw one with fewer than four.
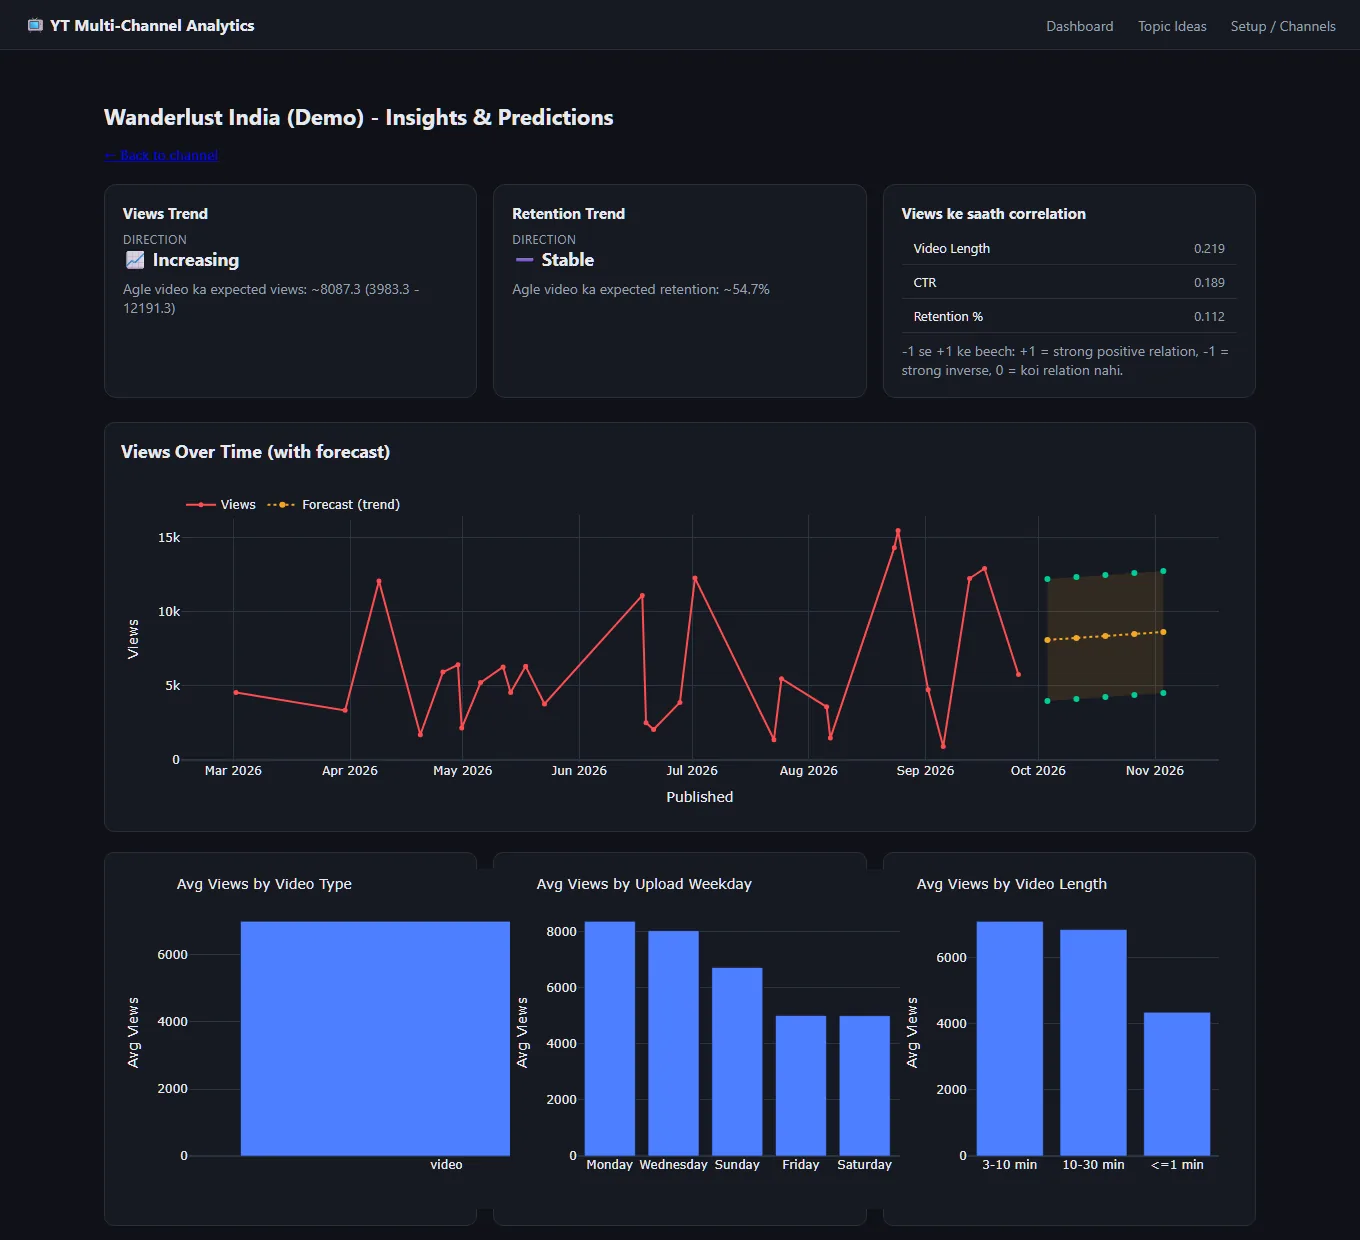
The Insights page on demo data: direction, a forecast range, and averages by type, weekday and length.
A caution about demo mode
The demo made the app look more capable than it is.
Demo mode generates three fake channels so the whole app can be tried without connecting an account. I added it for that reason, and it works. But the sample data includes CTR and impressions, so in demo mode every rule fires, including the two that never can on a real channel. That can make the dashboard look more finished than it really is.
The screenshots on these pages come from demo mode, so that none of my real numbers are published. That's why the pages say so, and why they spell out what a real channel would be missing.
The architecture
What's actually running under it.
- Server
Flask3, bound to 127.0.0.1 only, with a routes file of about 385 lines for the pages, sync, export and on-demand reports.- Google access
google-auth-oauthlibdesktop flow, one token file per channel, scopes limited toyoutube.readonlyandyt-analytics.readonly. A revenue scope exists in the config but is switched off.- Fetching
- An 840-line module on
google-api-python-client: video list (up to 200), metadata, grouped analytics queries with per-video fallback, and breakdowns by traffic source, device, operating system, country, playback location, sharing service, demographics, subscriber status and playlist. - Storage
SQLite, with snapshots, issues, topics, sync status, retention curves and per-video breakdowns in their own tables, and simple migrations.- Rules
- A 490-line diagnostics module: twelve rules, a funnel check, channel-level checks for upload gaps and momentum, and a channel comparison that ranks by high-severity issues.
- Insights
pandasto shape the data,numpyfor the linear fit,Plotlyfor the interactive charts.- Topics
pytrendsfor Google Trends (India) plus a YouTube search for the most-viewed videos of the last ~45 days in the same niche, combined into one score.- Front end
- Server-rendered templates, one stylesheet, and Chart.js and Plotly loaded from a CDN.
- Verification
- No automated tests. The rules were checked on demo data and on real channels, and the CTR finding by running real queries.
The outcome
Honest about where it actually is.
It does what I built it for. I can pull three channels, see which one needs me and which videos are the reason, and open a video's retention curve to find where viewers leave. The data stays on my computer and the access is read-only.
What it isn't: a product. It has one user and no login, the Google sign-in lapses every week or so while the project is in testing mode, the charts need internet to load their libraries, the interface is in Hinglish, and the rule everyone would want most, low CTR, can't work. If YouTube ever exposes impressions, the code is waiting.
Want to see the screens, or have something like this built for your own channels?
See the project page